
March 2025 Market Trends: Williamsburg, Yorktown & Surrounding Areas

Let's dive into some real estate metrics to give you a better understanding of the current market trends. These numbers include all single family homes, condos, and townhomes. Read through or skip to your Zip Code/Area.
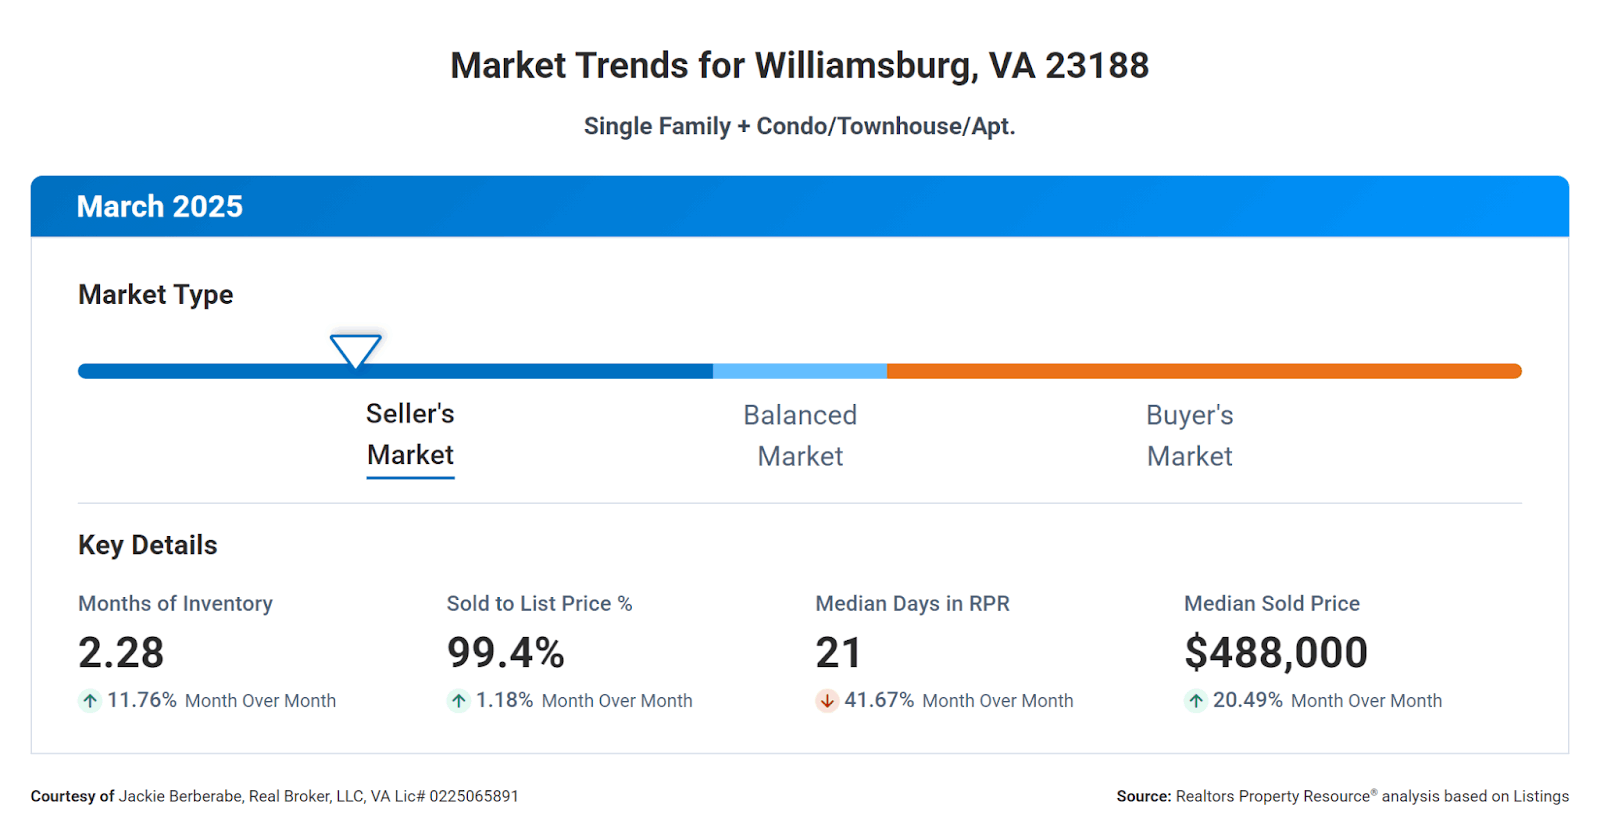
Williamsburg 23188 Market Trends
First up is for the 23188 area, we have the Months Supply of Inventory, which is sitting at 2.28. This means that at the current rate of sales, it would take 2.28 months to sell off all the available homes on the market.
Now, the 12-Month Change in Months of Inventory has seen a significant increase of +61.7%. This indicates that there are more homes available for sale compared to the previous year.
Next, we have the Median Days Homes are On the Market, which is a speedy 21 days. This shows that homes are selling relatively quickly in this market.
The Sold to List Price Percentage is at a high 99.4%, meaning that homes are typically selling very close to their listing price.
Lastly, the Median Sold Price is $488,000. This gives you an idea of what the average home is selling for in the current market.
So, what does all this mean for you as a Buyer or Seller? Well, with a low Months Supply of Inventory and homes selling at a high percentage of their list price, it's a competitive market out there. Sellers may have the upper hand, but Buyers shouldn't be discouraged. With homes selling quickly, it's important to act fast when you find a property you love.
Overall, these metrics paint a picture of a dynamic and active real estate market.
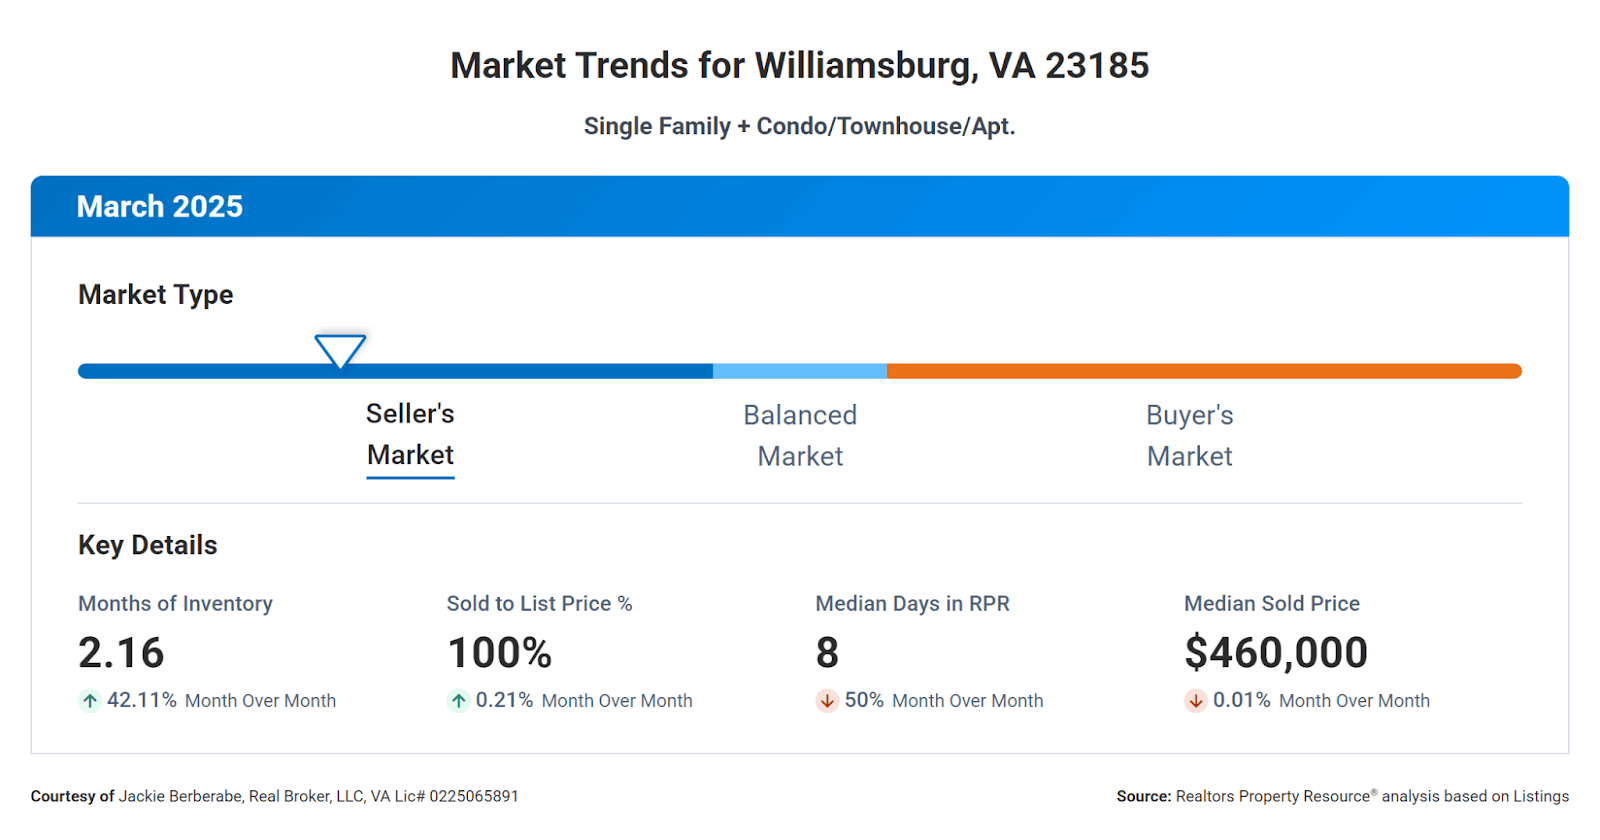
Williamsburg 23185 Market Trends:
For the 23185 area, the Months Supply of Inventory is at 2.16. This indicates a relatively fast-moving market, which could be good news for sellers looking to make a quick sale.
Now, the 12-Month Change in Months of Inventory has seen a significant increase of 72.8%. This means that there are more homes on the market compared to a year ago, which could potentially give buyers more options to choose from.
The Median Days Homes are On the Market is only 8 days. This shows that homes are selling quickly, so if you're a seller, you may not have to wait long to find a buyer.
The Sold to List Price Percentage is 100%, meaning that homes are typically selling for their full asking price. This suggests a strong seller's market, where buyers may need to act quickly and be prepared to make competitive offers.
Lastly, the Median Sold Price is $460,000. This gives you an idea of the average price for homes that are selling in the current market.
Overall, these metrics paint a picture of a fast-moving market with strong demand and competitive pricing.
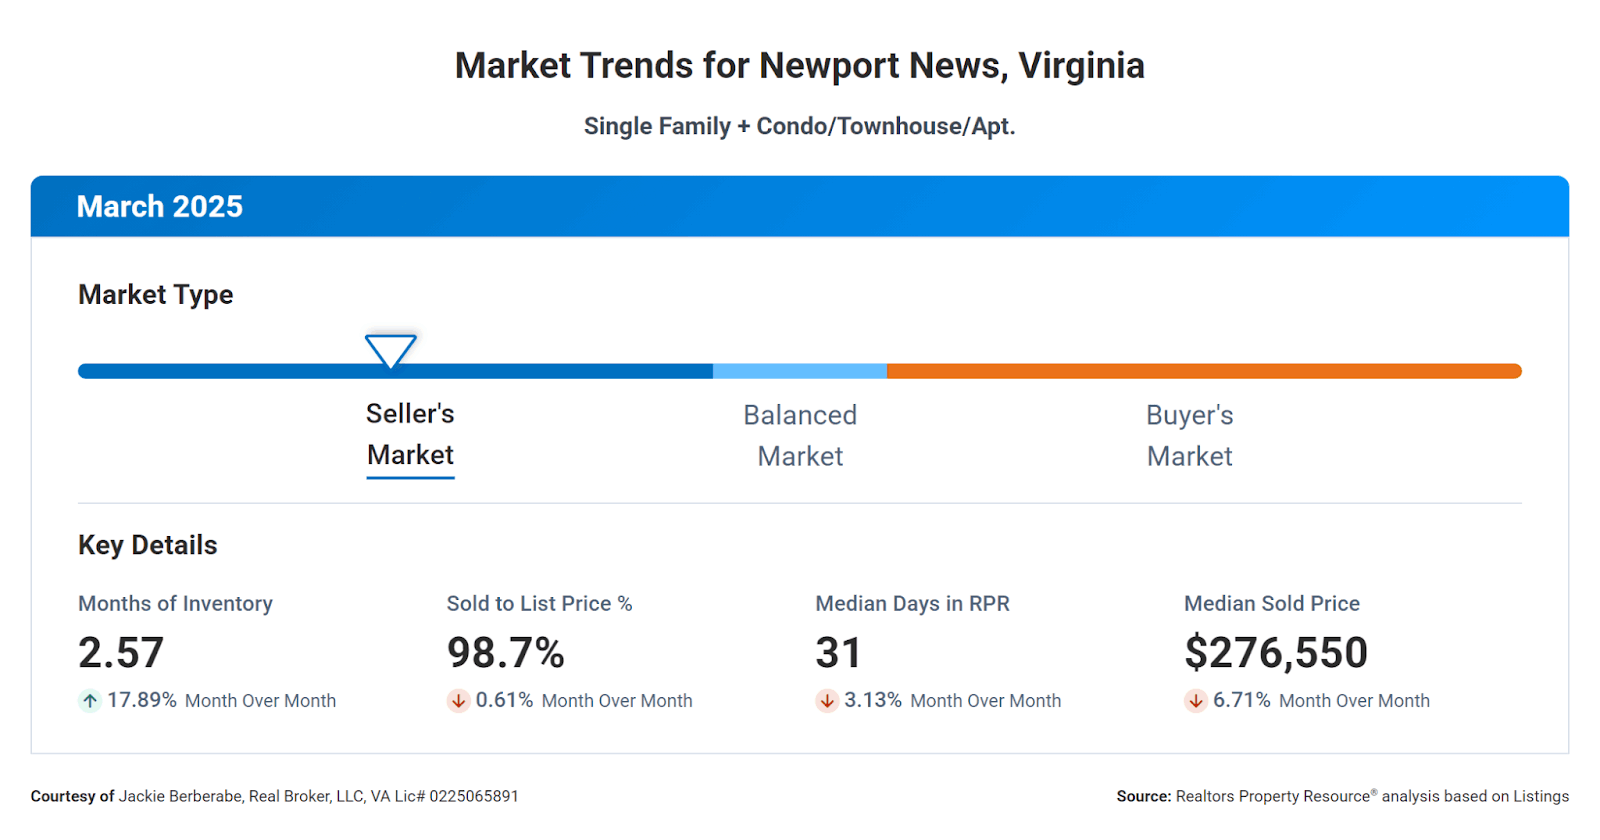
Newport News Market Trends:
Let’s take a quick look at what is happening in the Newport News real estate market right now.
The Months Supply of Inventory is sitting at 2.57. In simple terms, if no new homes hit the market, it would take about 2.57 months to sell everything currently available. With a number this low, we are still sitting in a seller’s market where demand is outpacing supply.
The 12-Month Change in Months of Inventory has jumped by +48.55%, which means more homes are hitting the market compared to this time last year. This could open up a few more options for buyers and maybe even start nudging us toward a more balanced market.
Median Days on Market is at 31 days, which tells us homes are still selling fairly quickly. Buyers are out there making moves, and competition is definitely still part of the game.
The Sold to List Price Percentage is at 98.7%, meaning most homes are selling very close to their asking price. Sellers are pricing wisely, and buyers are stepping up with strong offers.
And finally, the Median Sold Price in Newport News is currently $276,550. This gives you a good feel for what homes are selling for right now in the area.
Bottom line? Newport News is showing strong demand, competitive pricing, and relatively quick sales. Whether you are thinking about buying or selling, staying informed is key. And of course, having a knowledgeable, experienced agent on your side never hurts either.
Yorktown Market Trends
Here is a snapshot of what the Yorktown real estate market looked like in March.
The Months Supply of Inventory for March was 1.92. This means that at the current rate of sales, it would take about 1.92 months to sell all the available homes on the market. With a number this low, inventory is still tight and the competition is staying strong.
The 12-Month Change in Months of Inventory showed an increase of 43.28% compared to March of last year. This jump suggests that more homes are coming on the market, which could offer buyers a few more choices.
Median Days on Market in March was just 14 days, showing that homes are moving fast once they hit the market.
The Sold to List Price Percentage came in at 99.3%, meaning homes were selling very close to their asking price. Sellers are holding firm and buyers are stepping up.
And the Median Sold Price for March was $405,000, giving a strong sense of where the average price point is right now.
Bottom line? In March, Yorktown continued to show strong demand, low inventory, quick sales, and competitive offers.

Poquoson Market Trends:
Here is a look at how the Poquoson real estate market performed in March.
The Months Supply of Inventory for March was 2.47. This number tells us how long it would take to sell all the current homes on the market at the pace homes are selling today. A number this low usually points to a seller’s market, where demand is still outpacing supply.
The 12-Month Change in Months of Inventory showed a major increase of 80.29% compared to March of last year. This big jump means there are more homes available now, giving buyers more options than we have seen in the past.
Median Days on Market came in at 25 days, meaning homes were typically selling within about three and a half weeks. That is a good indicator of strong buyer interest and attractive pricing.
The Sold to List Price Percentage for March was 99.8%, showing that homes were selling very close to their listing price. Sellers are pricing accurately, and buyers are stepping up to meet those prices.
And the Median Sold Price in Poquoson was $479,500, giving a strong snapshot of what homes were selling for in the area during March.
Bottom line? In March, Poquoson stayed strong with quick sales, competitive offers, and healthy pricing. Whether you are thinking about buying or selling, it is a smart time to stay informed and have a strong strategy in place.

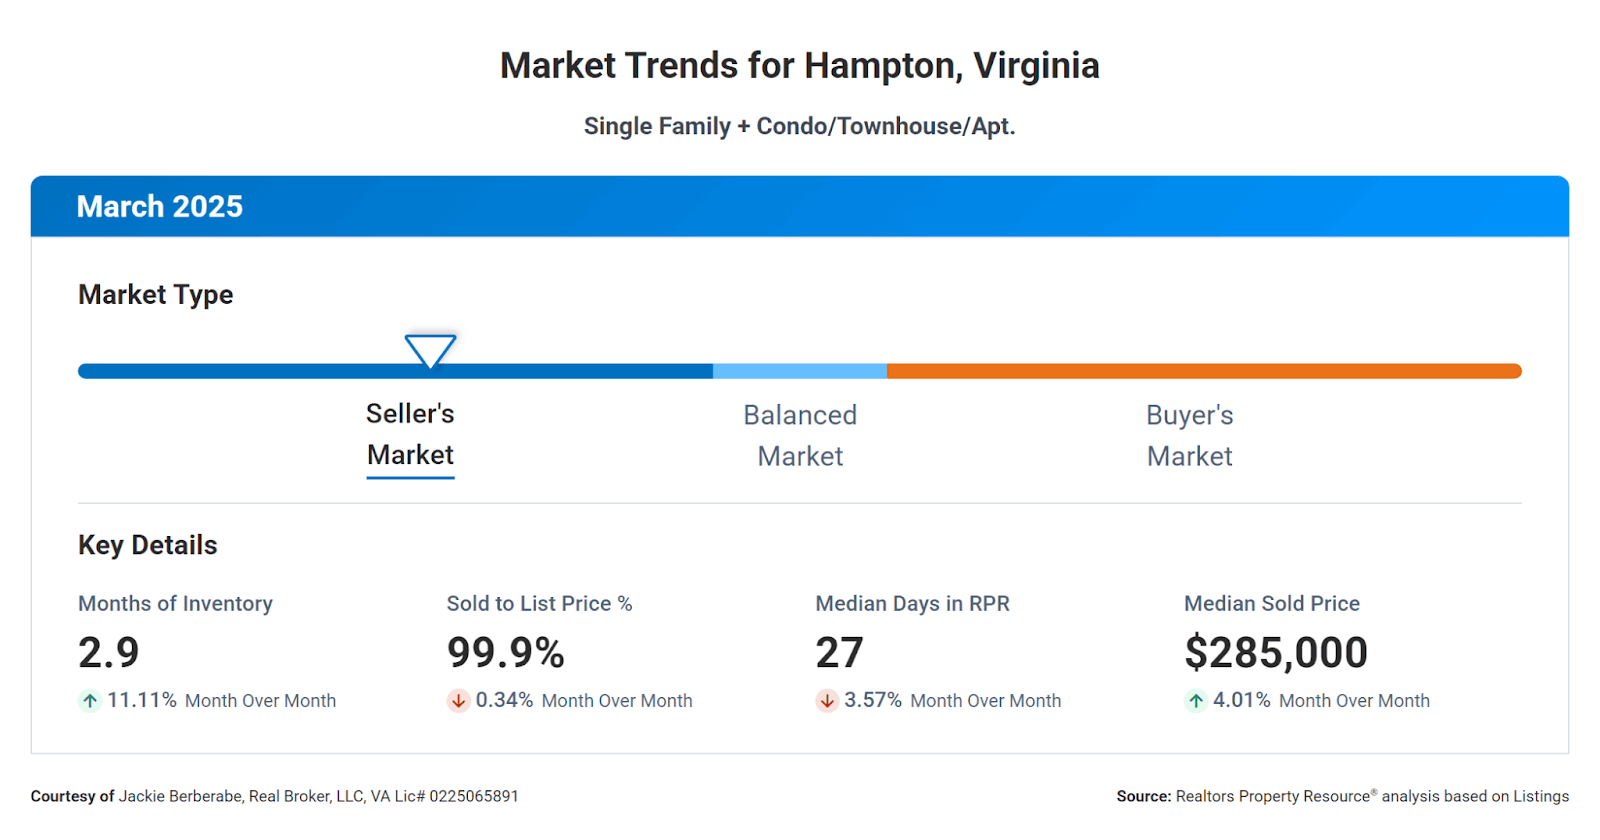
Hampton Market Trends
Here is a snapshot of the Hampton real estate market trends for March.
The Months Supply of Inventory for March was 2.9. This means that at the current pace of sales, it would take about 2.9 months to sell all the homes currently available. A lower supply like this typically points to a seller’s market, where buyer demand is still strong.
The 12-Month Change in Months of Inventory showed an increase of +70.59% compared to March of last year. This jump suggests that more homes are coming onto the market, which could eventually start moving the market toward a more balanced or buyer-friendly environment.
Median Days on Market in March was 27 days, showing that homes are still selling fairly quickly once they are listed. This continues to be a positive sign for sellers.
The Sold to List Price Percentage came in at 99.9%, meaning homes were selling very close to their listing price. Sellers are pricing well, and buyers are stepping up with strong offers.
The Median Sold Price for March in Hampton was $285,000, offering a strong snapshot of the middle price point for homes sold in the area.
Bottom line? Hampton’s March trends show strong buyer demand, quick sales, and competitive pricing. However, with inventory rising compared to last year, it is important for buyers and sellers to stay informed and watch how the market continues to shift.
Categories
Recent Posts


GET MORE INFORMATION